 One of the most common problems IT departments face is to correctly monitor the computer systems, as well as the alert system that notifies if something isn’t working as it should.
This issue also besets the world of microservices and DevOps because, whether we are talking about a cloud-based web service, a virtual machine, or a Kubernetes cluster, we need to monitor the entire infrastructure in real time. In order to solve this problem, the Grafana tool was developed.
Grafana tool
Grafana is a free software (based on Apache 2.0.) that lets you visualize data gathered by different supported sources like Graphite, InfluxDB or Prometheus.
These are tools that collect information about our infrastructure such as the resource usage (CPU, memory, network traffic, and so on) in a virtual machine, Kubernetes cluster or in the cluster’s containers. But the real power of Grafana is that it gives us the flexibility to create as many panels as we want with graphs where we can format and organize the information how we like. So, for example, the current CPU usage of a container or pod in a Kubernetes cluster can be shown in real time, or a graph that shows different values over time can be shown.
Grafana also has a variety of completely free, predefined panels and plugins that can be added to show information from different sources.
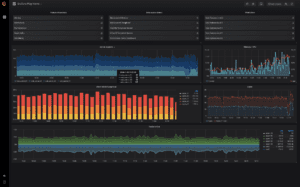
Figure 1: Grafana panel
All these values are displayed by querying the data collection tool. In this article, I recommend using Prometheus to collect data. Prometheus is an open-code software that permits data collection through extensions, whether these are developed by the Prometheus team itself, by the development community, or by third parties. We recommend Prometheus as the tool to use for gathering data because it’s easy to install and use, be it to collect data through Prometheus extensions like Prometheus Node Exporter in order to gather data on virtual machines, or to collect data through third-party extensions like Kube-State-Metrics in order to gather information on a Kubernetes cluster. Its power to interpret data when queries from Grafana are submitted, are also very good, since it allows us, for example, to directly calculate data such as the sum of memory usage of all pods in a Kubernetes cluster.
Some of its functions also allow us to go even further. On example would be to calculate, the data based on time ranges, like the number of network packets that have entered our environment in the last ten minutes. Another thing worth noting about Prometheus is that it scrapes information, i.e., you define what information it must search for, and where to look for that information, in the configuration.
Monitorizing Clusters & Kubernetes
Having explained the tools that can be used, it’s now time to talk about the architecture necessary to monitor multiple Kubernetes clusters using these tools.
- Firstly, you need a Grafana server. This could, , be running as a service in a virtual machine with an Ubuntu server.
- Secondly, the server where Grafana is running needs a Prometheus Server running as a Linux server – which we will call the global Prometheus server.
- And lastly you need a Prometheus server in each Kubernetes cluster. It’s easy to find a predefined Prometheus package for Kubernetes on the Internet – either by deploying or using Helm Chart repositories –, which you simply configure and launch on your Kubernetes clusters. We’ll call this Prometheus pod the local Prometheus server.
Grafana will show the data from the global Prometheus server. This latter will have all the local Prometheus servers in the different Kubernetes clusters – which normally listen on port 9090 – defined as targets in its configuration, and will collect the information that has, in turn, been gathered by each local Prometheus server.
Each local Prometheus server will be responsible for collecting all the information in its Kubernetes cluster using extensions like Node Exporter for nodes and Kube-State-Metrics for pods.
Each local Prometheus server must have a tag or label added with a different value in each Kubernetes cluster. An example would be, using a “cluster_name” tag with a different value in each cluster. This way we can distinguish between clusters when we query the global Prometheus server in Grafana adding cluster_name=”kube_cluster_one” or cluster_name=”kube_cluster_two” to the query.
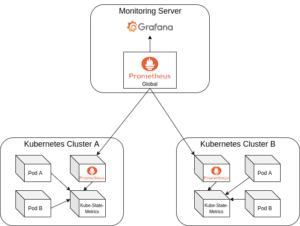
Figure 2: Monitor Server with Kubernetes Clusters
With this, we already have a way to monitor multiple Kubernetes clusters with Grafana and Prometheus. While there are certainly other tools and architectures with similar functions, this format has given Teldat the best results to date in monitoring our SDN solutions, such as SD-WAN. We can monitor all the parameters, in all enviroments, in real time and thus be constantly sure that everything works correctly.


